NOTES: This analysis was done independently by an engineer
after successful completion of the course Statistics and
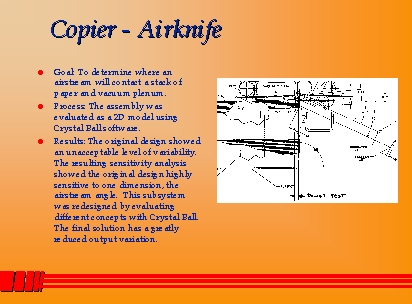
Principles of Tolerance . The initial evaluation of the assembly
and the airstream, using Crystal Ball software, demonstrated that
the design did not meet specification. Moreover, the sensitivity
analysis showed that most of the variability was the result of
one dimension. Possible design changes were modeled in Crystal
Ball to determine what, if any, the proposed change would have on
overall variability. The final design of this interface reduced
variability from 0.075 to 0.016. The final sensitivity analysis
shows that the feature which was responsible for nearly 90% of
overall variability in the initial design had been reduced to 40%
in the final design.